Banknaked vs Dividend Data
Side-by-side comparison to help you choose the right product.

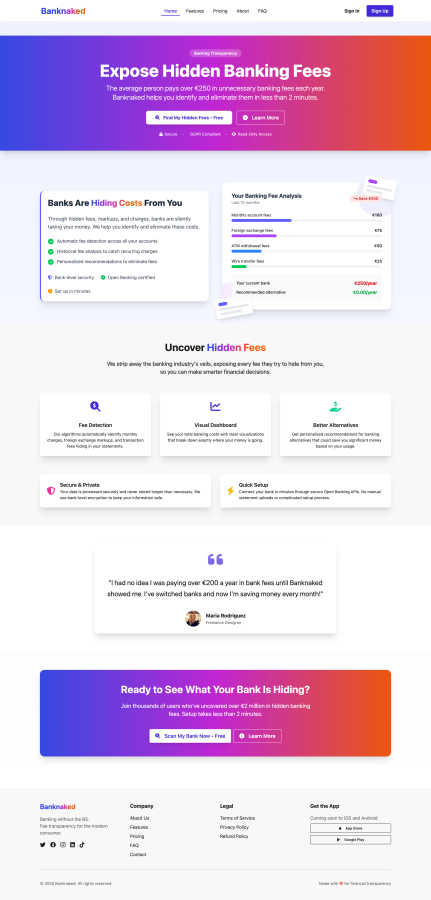
Banknaked
Banknaked reveals and eliminates hidden banking fees in under 2 minutes using secure Open Banking technology.
Last updated: March 1, 2026
Dividend Data
Get data & 30+ yrs history in Sheets/Excel fast.
Visual Comparison
Banknaked
Dividend Data

Overview
About Banknaked
Banknaked is a groundbreaking financial transparency platform tailored to reveal the hidden fees that traditional banks impose on consumers. It empowers users by providing a thorough, actionable breakdown of all costs linked to their bank accounts, enabling informed financial decisions. By utilizing secure Open Banking APIs, Banknaked connects directly to users' bank accounts with read-only access. This allows the platform to automatically scan transactions and identify various charges, including monthly maintenance fees, foreign exchange markups, ATM withdrawal fees, wire transfer costs, and other often overlooked expenses. The main audience for Banknaked ranges from regular consumers who may not scrutinize their bank statements to financially savvy individuals looking to enhance their banking experience. The core value proposition lies in its ability to convert complex banking data into understandable visual dashboards and plain-language explanations, ultimately putting control and potential savings back into the hands of the customers.
About Dividend Data
Dividend Data brings 30+ years of stock market data for 80,000+ tickers directly into your Google Sheets and Microsoft Excel spreadsheets — no API keys, no coding, no copying and pasting.
Built for dividend & fundamental investors, it gives you instant access to dividends, yields, payout ratios, growth rates, financial statements, earnings, ratios, price history, and 100+ metrics through simple custom formulas.
Just type a formula. The data appears live.
What makes it different:
• Free tier with 2,500 monthly credits — no trial expiration
• 16 custom functions covering everything dividend investors need
• 30+ years of historical data
• Works in both Google Sheets and Microsoft Excel
• Built by a dividend investor, for dividend investors
Used by fundamental investors who want institutional-grade data without the institutional price tag.