ChartFromText vs Decode This Text
Side-by-side comparison to help you choose the right product.
ChartFromText
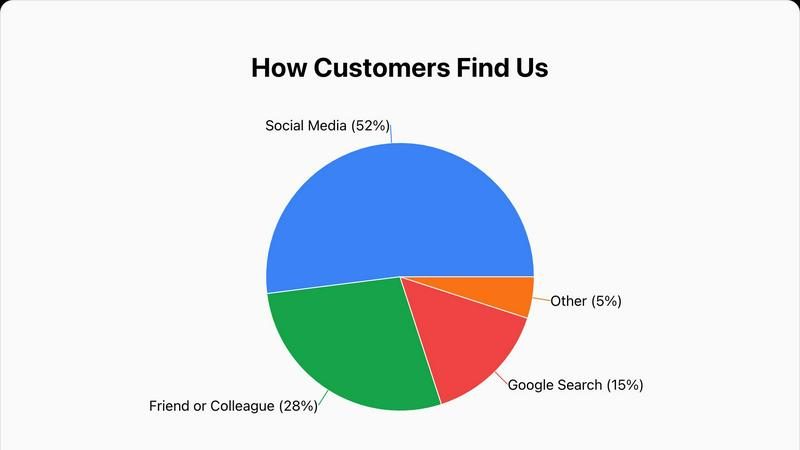
ChartFromText instantly converts your text data into clear, professional pie charts for effortless visualization.
Last updated: February 28, 2026
Decode This Text
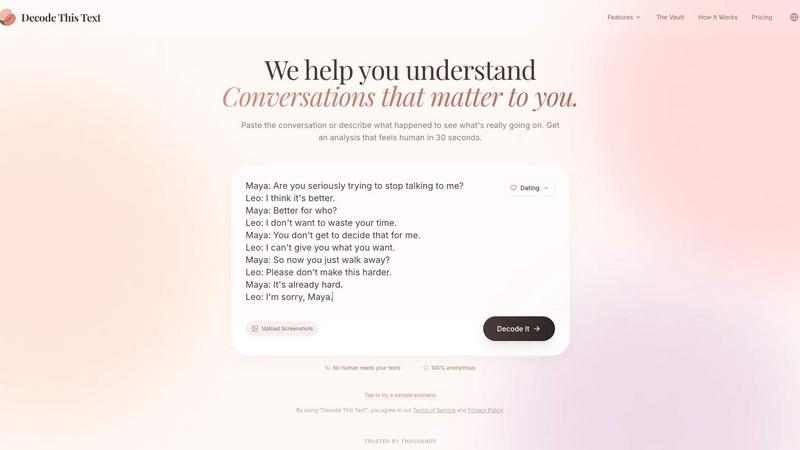
Decode This Text provides instant, human-like analysis of confusing conversations in just thirty seconds.
Last updated: February 28, 2026
Visual Comparison
ChartFromText
Decode This Text
Feature Comparison
ChartFromText
Instant Text-to-Chart Conversion Engine
At the heart of ChartFromText is its sophisticated parsing engine that accepts data in simple, plain-text formats. Users can copy information directly from a CSV file, a spreadsheet cell range, or a text document and paste it into the tool's input field. The engine automatically recognizes patterns like "Label, Value" on new lines, eliminating the need for manual data entry into complex table systems. This direct conversion from text to a structured visual is the defining feature, enabling the creation of a pie chart, bar graph, or line graph in a matter of seconds, which represents a significant efficiency gain over traditional methods.
Comprehensive and Intuitive Customization Suite
Beyond basic generation, ChartFromText provides a robust set of customization options to ensure the final chart meets specific aesthetic and communicative needs. Users have full control over the chart's title, which can be tailored for context. The background color can be adjusted to align with brand guidelines or presentation themes. Most notably, the tool offers multiple display modes for data labels: values can be placed inside chart segments for direct association, shown with connecting lines for detailed breakdowns, or consolidated into a separate legend for a clean, minimalist visual. This flexibility allows for professional-grade tailoring without complexity.
Truly Free and No-Account-Access Model
ChartFromText operates on a completely free and accessible model. There are no tiered pricing plans, feature limitations, or watermarks applied to downloaded charts. Every customization option is available from the outset without any paywalls. Furthermore, the tool respects user privacy and convenience by requiring no account creation, login, or submission of personal information. Users can generate and download an unlimited number of charts anonymously, making it an exceptionally low-barrier tool for one-time use or repeated, high-volume chart creation needs.
High-Resolution PNG Export and Multi-Chart Support
The utility of a generated chart is fully realized in its application. ChartFromText ensures professional output by allowing users to download their creations as high-resolution PNG image files. This format guarantees that visuals remain crisp and clear when embedded in digital documents, presentation slides, printed reports, or websites. Additionally, while prominently featuring a pie and donut chart maker, the platform supports the generation of other fundamental chart types like bar and line graphs, making it a versatile toolkit for various data storytelling requirements beyond part-to-whole analysis.
Decode This Text
Multi-Format Input and Contextual Analysis
The platform accepts user input in three flexible formats: direct text pasting, screenshot uploads, or a descriptive narrative of the event. This versatility ensures that any conversational context can be captured and analyzed, whether it's a direct quote, a visual of a chat history, or a user's recollection of an interaction. The AI then performs a deep contextual analysis, examining not just the words but also timing, response patterns, and linguistic cues to construct a holistic understanding of the subtext and underlying dynamics at play.
Tone, Effort, and Intent Metrics
A cornerstone feature is the presentation of clear, quantified metrics for each analyzed message or conversation. The tool evaluates and displays percentages for Tone (the emotional temperature, e.g., friendly, cold, sarcastic), Effort (the level of engagement and investment shown by the other party), and Intent (their underlying motives or interest level). This data-driven breakdown moves users beyond gut feelings to an evidence-based assessment of the communication's true nature.
Pattern Detection and Behavioral Insights
Decode This Text's AI is trained to identify subtle behavioral patterns that individuals might overlook in the heat of the moment. This includes detecting if a contact only messages late at night, consistently avoids answering direct questions, or if their messages are becoming progressively shorter and less engaged. By highlighting these trends, the tool provides crucial "reality check" insights into the other person's communication habits and potential intentions.
AI-Generated Response Suggestions
To bridge analysis into action, the tool provides practical, AI-crafted response options. Users are presented with multiple tailored suggestions for how to reply, categorized by approach—such as calm, direct, or firm. This feature eliminates the paralysis of not knowing what to say next, equipping users with confident, context-appropriate language to navigate the conversation forward effectively.
Use Cases
ChartFromText
Academic and Educational Material Development
Educators and students can leverage ChartFromText to rapidly create visual aids for essays, research papers, science fair projects, and classroom presentations. A teacher can quickly illustrate survey results from a class poll, while a student can visualize historical population data or scientific experiment results. The tool's simplicity allows users to focus on data interpretation rather than software mechanics, making it an ideal companion for enhancing learning materials and improving the comprehension of statistical concepts across all educational levels.
Business Reporting and Presentation Enhancement
Business professionals across departments such as marketing, finance, and operations can use ChartFromText to generate instant visuals for internal reports, client presentations, and stakeholder updates. For example, a marketing manager can paste quarterly advertising spend across channels to create a budget allocation pie chart for a review meeting. The ability to quickly produce a clear, professional chart from raw data in emails or spreadsheets facilitates faster decision-making and more impactful communication of key business metrics without relying on dedicated design resources.
Content Creation for Digital Media
Bloggers, journalists, and social media managers can utilize ChartFromText to enrich their online content with engaging, data-driven graphics. When writing an article about industry trends, a blogger can easily convert a few key statistics into a bar graph to break up text and illustrate a point. The high-resolution download ensures the image is web-ready, and the no-account feature streamlines the workflow for creators who need a quick, reliable tool without committing to a subscription for occasional use.
Personal Finance and Project Budget Tracking
Individuals and small team leads can apply ChartFromText to visualize personal or project-based financial data. Someone managing a household budget can input monthly expense categories and amounts to see a clear pie chart of spending distribution. Similarly, a freelancer or project manager can illustrate how a project's total budget is allocated across different workstreams like development, design, and administration. This visual breakdown makes it easier to identify areas for adjustment and communicate financial plans simply and effectively.
Decode This Text
Deciphering Romantic and Dating Ambiguity
This is a primary use case, addressing the common anxieties of modern dating. Users can analyze texts from potential partners to understand mixed signals, gauge genuine interest after a date, interpret sudden changes in communication frequency, or decode the meaning behind vague phrases like "I'll let you know." It helps answer pressing questions such as whether someone is truly busy or is losing interest, providing clarity that prevents over-analysis and regretful messages.
Interpreting Professional and Workplace Communication
The tool is invaluable for navigating office politics and professional etiquette. Employees can use it to parse the meaning behind a terse, one-word email from a manager, understand the real implication behind phrases like "we'll keep your resume on file," or craft a polite but firm way to say "no" to a request. It aids in understanding power dynamics and unspoken expectations in professional correspondence.
Navigating Friendships and Family Dynamics
Decode This Text helps users manage complex social relationships within their inner circle. It can be used to understand why a group chat went silent after a specific message, interpret a family member's passive-aggressive comment, or determine if a friend's distant behavior is a sign of a problem or simply a reflection of their own stress. It acts as an impartial mediator for social friction.
Preventing Regret and Providing Emotional Validation
A critical use case is serving as a preventative "second opinion" before sending an emotionally charged message. By analyzing the situation first, users can avoid sending texts they might "regret forever." Furthermore, for many users, the tool's analysis provides essential emotional validation—confirming their perceptions or offering a wiser, more objective perspective that friends, who may be biased, cannot.
Overview
About ChartFromText
ChartFromText is a specialized, web-based data visualization platform engineered to transform raw, unstructured text data into professional-grade charts with unparalleled speed and simplicity. Its core functionality revolves around an intelligent text parser that interprets plain text inputs, such as "Marketing, 22000" on separate lines, and instantly converts them into visual formats including pie charts, bar graphs, and line graphs. The tool is meticulously designed for a broad spectrum of users who require immediate, hassle-free chart creation without the steep learning curve of traditional software like Excel or complex design tools. This includes students compiling data for projects, educators creating instructional materials, content creators enhancing blogs and social media, and business professionals needing quick visuals for reports and presentations.
The primary value proposition of ChartFromText is its elimination of procedural friction in data visualization. By removing the need for manual table creation, software installation, account registration, or any form of payment, it democratizes access to effective charting. Users can focus entirely on their data's narrative, pasting it directly from sources like spreadsheets, documents, or notes. The platform then handles the rendering, offering customization options for titles, colors, and label display, culminating in a downloadable, high-resolution image. In essence, ChartFromText serves as an immediate bridge between raw data and actionable insight, making complex information accessible, understandable, and presentation-ready within seconds.
About Decode This Text
Decode This Text is a sophisticated AI-powered communication analysis tool engineered to demystify the complex subtext of digital conversations. It functions as a personal communication consultant, providing users with a clear, objective breakdown of the underlying intentions, emotional tone, and social dynamics present in text-based exchanges. The tool is designed for anyone navigating the often ambiguous world of modern messaging, from deciphering a partner's vague texts and a friend's sudden silence to interpreting a boss's terse email or a client's non-committal response. Its core value proposition lies in transforming subjective anxiety into objective clarity. By pasting a conversation, uploading a screenshot, or describing a scenario, users receive a comprehensive, human-like analysis in approximately 30 seconds. This process not only decodes what is being said but, more importantly, what is meant, thereby empowering users to respond with confidence, improve interpersonal relationships, and avoid costly misunderstandings. With a staunch commitment to privacy—ensuring no human ever reads the submitted texts—Decode This Text offers a secure, anonymous, and invaluable service for enhancing emotional intelligence and communication efficacy in both personal and professional spheres.
Frequently Asked Questions
ChartFromText FAQ
What data format does ChartFromText accept for input?
ChartFromText is designed to accept simple, plain-text formats for effortless data entry. The most common and recommended format is to enter each data point on a new line, with the label and value separated by a comma, like this: "Label, Value". For example: "Development, 45000". The tool's intelligent parser is built to recognize this structure automatically. You can typically copy this directly from a two-column spreadsheet selection or type it manually, making the process highly flexible and user-friendly.
Is ChartFromText really free, and are there any watermarks?
Yes, ChartFromText is completely free to use with no hidden costs or subscription requirements. There are no watermarks placed on any of the charts you generate and download. All features, including full customization options and high-resolution PNG downloads, are available without any limitations. The service operates without requiring user accounts, ensuring both cost-free and privacy-respecting access to all its functionalities.
Can I create charts other than pie charts with this tool?
Absolutely. While the platform prominently features its pie and donut chart generator due to their specific use case, ChartFromText is capable of creating other fundamental chart types. This includes bar graphs, which are ideal for comparing quantities across different categories, and line graphs, which are perfect for illustrating trends over time. The same simple text-input principle applies, making it a versatile tool for various data visualization needs beyond part-to-whole analysis.
How do I download and use the chart I create?
Once you have pasted your data and customized your chart using the options for title, colors, and label display, you click the "Generate Chart" button. A preview of your chart will appear on the page. After verifying the chart meets your needs, simply click the "Download as PNG" button. This will save a high-resolution PNG image file directly to your device. You can then insert this image into presentation software like PowerPoint, word processors like Microsoft Word, website builders, or any other digital or print medium.
Decode This Text FAQ
How does Decode This Text protect my privacy?
Privacy is a fundamental principle of the service. The platform is designed to be 100% anonymous, and the company explicitly states that "no human reads your texts." All analysis is performed by automated AI systems. Users are encouraged to review the platform's Terms of Service and Privacy Policy for detailed information on data handling, security measures, and anonymity guarantees.
What kind of input does the tool accept for analysis?
The tool offers three primary input methods for maximum convenience. You can directly paste the text of the conversation, upload a screenshot or photo of your chat (which the AI will read), or simply provide a written description of what happened. This flexibility ensures you can get an analysis regardless of how the conversation is stored or remembered.
What specific elements does the analysis cover?
The comprehensive analysis examines multiple layers of communication. It assesses the emotional tone (e.g., warmth, sarcasm, hostility), measures the apparent effort and engagement level of the participants, and deduces the underlying intent or motivation. It also detects behavioral patterns, such as avoidance or inconsistent messaging, and synthesizes these elements into a clear explanation of "what's really going on."
How is this tool better than asking a friend for advice?
While friends can offer support, their advice is often biased by their personal relationship with you and their own experiences. Decode This Text provides a completely objective, data-informed analysis focused solely on the communication patterns present in the text. It acts as an impartial, "wise older sibling" figure, offering consistent, pattern-based insights without emotional baggage, and is available instantly without the social burden of asking "for the hundredth time."
Alternatives
ChartFromText Alternatives
ChartFromText is a specialized productivity tool within the data visualization category. It streamlines the process of creating charts by allowing users to input plain text, which is then instantly converted into visual formats like pie, bar, and line graphs. This approach is designed for simplicity and speed, making it accessible to a broad audience. Users may seek alternatives to ChartFromText for various reasons. Common motivations include the need for more advanced chart types, deeper customization and analytical capabilities, integration with other software platforms, or different pricing models. Some users require offline functionality or enterprise-level features that a basic online tool may not provide. When evaluating an alternative, key considerations should include the range of supported chart types, the depth of customization and data manipulation tools, export quality and format options, and overall ease of use. The ideal choice balances the tool's power with the user's specific technical skill level and project requirements, ensuring it enhances rather than complicates the workflow.
Decode This Text Alternatives
Decode This Text is a productivity tool designed to analyze and clarify ambiguous or confusing written communication. It falls within the broader category of communication enhancement and text analysis software, helping users interpret the subtext, tone, and intent behind messages from colleagues, friends, or clients. Users often seek alternatives to such tools for various practical reasons. These can include budget constraints, as pricing models vary widely, or a need for specific features not offered, such as integration with other platforms, support for different languages, or more advanced analytical capabilities. Some may also require a solution that works on a specific operating system or within a particular workflow. When evaluating an alternative, key considerations should include the accuracy and depth of the analysis provided, the tool's ease of use and speed, and its commitment to data privacy and security. It's also wise to assess the cost relative to the value delivered and whether the tool can handle the specific types of communication challenges you face most frequently in your personal or professional life.