ChartFromText
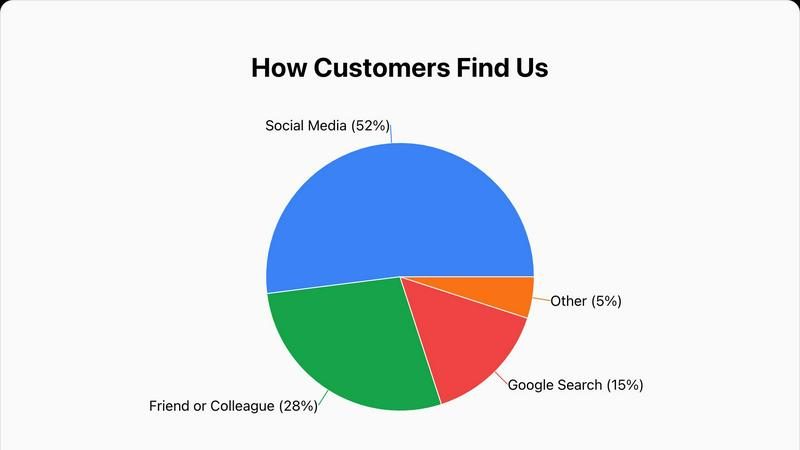
ChartFromText instantly converts your text data into clear, professional pie charts for effortless visualization.
VisitPublished on:
November 5, 2025
Pricing:
About ChartFromText
ChartFromText is a specialized, web-based data visualization platform engineered to transform raw, unstructured text data into professional-grade charts with unparalleled speed and simplicity. Its core functionality revolves around an intelligent text parser that interprets plain text inputs, such as "Marketing, 22000" on separate lines, and instantly converts them into visual formats including pie charts, bar graphs, and line graphs. The tool is meticulously designed for a broad spectrum of users who require immediate, hassle-free chart creation without the steep learning curve of traditional software like Excel or complex design tools. This includes students compiling data for projects, educators creating instructional materials, content creators enhancing blogs and social media, and business professionals needing quick visuals for reports and presentations.
The primary value proposition of ChartFromText is its elimination of procedural friction in data visualization. By removing the need for manual table creation, software installation, account registration, or any form of payment, it democratizes access to effective charting. Users can focus entirely on their data's narrative, pasting it directly from sources like spreadsheets, documents, or notes. The platform then handles the rendering, offering customization options for titles, colors, and label display, culminating in a downloadable, high-resolution image. In essence, ChartFromText serves as an immediate bridge between raw data and actionable insight, making complex information accessible, understandable, and presentation-ready within seconds.
Features of ChartFromText
Instant Text-to-Chart Conversion Engine
At the heart of ChartFromText is its sophisticated parsing engine that accepts data in simple, plain-text formats. Users can copy information directly from a CSV file, a spreadsheet cell range, or a text document and paste it into the tool's input field. The engine automatically recognizes patterns like "Label, Value" on new lines, eliminating the need for manual data entry into complex table systems. This direct conversion from text to a structured visual is the defining feature, enabling the creation of a pie chart, bar graph, or line graph in a matter of seconds, which represents a significant efficiency gain over traditional methods.
Comprehensive and Intuitive Customization Suite
Beyond basic generation, ChartFromText provides a robust set of customization options to ensure the final chart meets specific aesthetic and communicative needs. Users have full control over the chart's title, which can be tailored for context. The background color can be adjusted to align with brand guidelines or presentation themes. Most notably, the tool offers multiple display modes for data labels: values can be placed inside chart segments for direct association, shown with connecting lines for detailed breakdowns, or consolidated into a separate legend for a clean, minimalist visual. This flexibility allows for professional-grade tailoring without complexity.
Truly Free and No-Account-Access Model
ChartFromText operates on a completely free and accessible model. There are no tiered pricing plans, feature limitations, or watermarks applied to downloaded charts. Every customization option is available from the outset without any paywalls. Furthermore, the tool respects user privacy and convenience by requiring no account creation, login, or submission of personal information. Users can generate and download an unlimited number of charts anonymously, making it an exceptionally low-barrier tool for one-time use or repeated, high-volume chart creation needs.
High-Resolution PNG Export and Multi-Chart Support
The utility of a generated chart is fully realized in its application. ChartFromText ensures professional output by allowing users to download their creations as high-resolution PNG image files. This format guarantees that visuals remain crisp and clear when embedded in digital documents, presentation slides, printed reports, or websites. Additionally, while prominently featuring a pie and donut chart maker, the platform supports the generation of other fundamental chart types like bar and line graphs, making it a versatile toolkit for various data storytelling requirements beyond part-to-whole analysis.
Use Cases of ChartFromText
Academic and Educational Material Development
Educators and students can leverage ChartFromText to rapidly create visual aids for essays, research papers, science fair projects, and classroom presentations. A teacher can quickly illustrate survey results from a class poll, while a student can visualize historical population data or scientific experiment results. The tool's simplicity allows users to focus on data interpretation rather than software mechanics, making it an ideal companion for enhancing learning materials and improving the comprehension of statistical concepts across all educational levels.
Business Reporting and Presentation Enhancement
Business professionals across departments such as marketing, finance, and operations can use ChartFromText to generate instant visuals for internal reports, client presentations, and stakeholder updates. For example, a marketing manager can paste quarterly advertising spend across channels to create a budget allocation pie chart for a review meeting. The ability to quickly produce a clear, professional chart from raw data in emails or spreadsheets facilitates faster decision-making and more impactful communication of key business metrics without relying on dedicated design resources.
Content Creation for Digital Media
Bloggers, journalists, and social media managers can utilize ChartFromText to enrich their online content with engaging, data-driven graphics. When writing an article about industry trends, a blogger can easily convert a few key statistics into a bar graph to break up text and illustrate a point. The high-resolution download ensures the image is web-ready, and the no-account feature streamlines the workflow for creators who need a quick, reliable tool without committing to a subscription for occasional use.
Personal Finance and Project Budget Tracking
Individuals and small team leads can apply ChartFromText to visualize personal or project-based financial data. Someone managing a household budget can input monthly expense categories and amounts to see a clear pie chart of spending distribution. Similarly, a freelancer or project manager can illustrate how a project's total budget is allocated across different workstreams like development, design, and administration. This visual breakdown makes it easier to identify areas for adjustment and communicate financial plans simply and effectively.
Frequently Asked Questions
What data format does ChartFromText accept for input?
ChartFromText is designed to accept simple, plain-text formats for effortless data entry. The most common and recommended format is to enter each data point on a new line, with the label and value separated by a comma, like this: "Label, Value". For example: "Development, 45000". The tool's intelligent parser is built to recognize this structure automatically. You can typically copy this directly from a two-column spreadsheet selection or type it manually, making the process highly flexible and user-friendly.
Is ChartFromText really free, and are there any watermarks?
Yes, ChartFromText is completely free to use with no hidden costs or subscription requirements. There are no watermarks placed on any of the charts you generate and download. All features, including full customization options and high-resolution PNG downloads, are available without any limitations. The service operates without requiring user accounts, ensuring both cost-free and privacy-respecting access to all its functionalities.
Can I create charts other than pie charts with this tool?
Absolutely. While the platform prominently features its pie and donut chart generator due to their specific use case, ChartFromText is capable of creating other fundamental chart types. This includes bar graphs, which are ideal for comparing quantities across different categories, and line graphs, which are perfect for illustrating trends over time. The same simple text-input principle applies, making it a versatile tool for various data visualization needs beyond part-to-whole analysis.
How do I download and use the chart I create?
Once you have pasted your data and customized your chart using the options for title, colors, and label display, you click the "Generate Chart" button. A preview of your chart will appear on the page. After verifying the chart meets your needs, simply click the "Download as PNG" button. This will save a high-resolution PNG image file directly to your device. You can then insert this image into presentation software like PowerPoint, word processors like Microsoft Word, website builders, or any other digital or print medium.
Similar to ChartFromText
AgencyFlo is the AI-native operating system for agencies - one platform for projects, time, CRM, proposals, contracts and invoicing.
AI-powered Upwork job feed. Every new job is scored against your profile and strategy in real time, and you get an instant notification
AudiobookHub — Audiobook Summaries, AI Text-to-Speech & Theme Songs
Upload your notes, get AI-powered study guides, flashcards & quizzes instantly. Ace any exam in half the time.