ChartFromText vs ScopeSnap
Side-by-side comparison to help you choose the right product.
ChartFromText
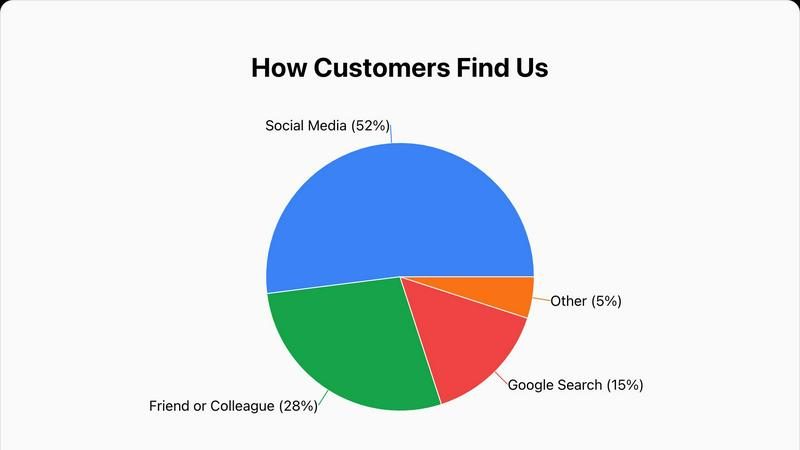
ChartFromText instantly converts your text data into clear, professional pie charts for effortless visualization.
Last updated: February 28, 2026
ScopeSnap
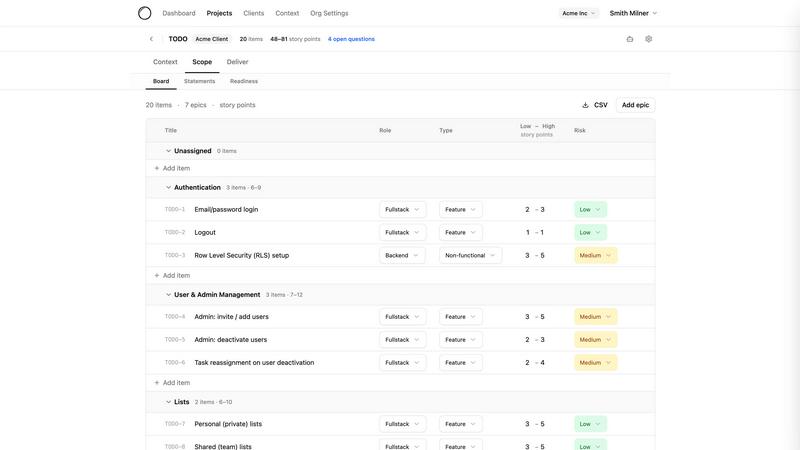
ScopeSnap transforms discovery notes into structured project scopes, accurate estimates, and polished proposals in minutes for freelancers and.
Last updated: March 18, 2026
Visual Comparison
ChartFromText
ScopeSnap
Feature Comparison
ChartFromText
Instant Text-to-Chart Conversion Engine
At the heart of ChartFromText is its sophisticated parsing engine that accepts data in simple, plain-text formats. Users can copy information directly from a CSV file, a spreadsheet cell range, or a text document and paste it into the tool's input field. The engine automatically recognizes patterns like "Label, Value" on new lines, eliminating the need for manual data entry into complex table systems. This direct conversion from text to a structured visual is the defining feature, enabling the creation of a pie chart, bar graph, or line graph in a matter of seconds, which represents a significant efficiency gain over traditional methods.
Comprehensive and Intuitive Customization Suite
Beyond basic generation, ChartFromText provides a robust set of customization options to ensure the final chart meets specific aesthetic and communicative needs. Users have full control over the chart's title, which can be tailored for context. The background color can be adjusted to align with brand guidelines or presentation themes. Most notably, the tool offers multiple display modes for data labels: values can be placed inside chart segments for direct association, shown with connecting lines for detailed breakdowns, or consolidated into a separate legend for a clean, minimalist visual. This flexibility allows for professional-grade tailoring without complexity.
Truly Free and No-Account-Access Model
ChartFromText operates on a completely free and accessible model. There are no tiered pricing plans, feature limitations, or watermarks applied to downloaded charts. Every customization option is available from the outset without any paywalls. Furthermore, the tool respects user privacy and convenience by requiring no account creation, login, or submission of personal information. Users can generate and download an unlimited number of charts anonymously, making it an exceptionally low-barrier tool for one-time use or repeated, high-volume chart creation needs.
High-Resolution PNG Export and Multi-Chart Support
The utility of a generated chart is fully realized in its application. ChartFromText ensures professional output by allowing users to download their creations as high-resolution PNG image files. This format guarantees that visuals remain crisp and clear when embedded in digital documents, presentation slides, printed reports, or websites. Additionally, while prominently featuring a pie and donut chart maker, the platform supports the generation of other fundamental chart types like bar and line graphs, making it a versatile toolkit for various data storytelling requirements beyond part-to-whole analysis.
About ScopeSnap
AI-Driven Backlog Creation
ScopeSnap utilizes advanced AI technology to automatically generate epics and scope items from raw discovery notes. It intelligently surfaces open questions and flags assumptions, which helps users identify gaps in information early in the project planning process.
Streamlined Refinement Process
The platform allows users to iteratively refine their project scopes. Developers can review the structured backlog, assign roles, set estimates, and resolve open questions in a collaborative environment, ensuring that all team members are on the same page.
Proposal Generation
Once the project scope is finalized, ScopeSnap automatically generates a polished Proposal or Statement of Work (SOW). This feature saves users significant time as it eliminates the need to create documents from scratch, ensuring that proposals are not only professional but also aligned with the defined scope.
Client Communication Tools
ScopeSnap includes features that facilitate seamless communication with clients. Users can easily share their proposals and project scopes, making it simple to keep clients informed and engaged throughout the project lifecycle.
Use Cases
ChartFromText
Academic and Educational Material Development
Educators and students can leverage ChartFromText to rapidly create visual aids for essays, research papers, science fair projects, and classroom presentations. A teacher can quickly illustrate survey results from a class poll, while a student can visualize historical population data or scientific experiment results. The tool's simplicity allows users to focus on data interpretation rather than software mechanics, making it an ideal companion for enhancing learning materials and improving the comprehension of statistical concepts across all educational levels.
Business Reporting and Presentation Enhancement
Business professionals across departments such as marketing, finance, and operations can use ChartFromText to generate instant visuals for internal reports, client presentations, and stakeholder updates. For example, a marketing manager can paste quarterly advertising spend across channels to create a budget allocation pie chart for a review meeting. The ability to quickly produce a clear, professional chart from raw data in emails or spreadsheets facilitates faster decision-making and more impactful communication of key business metrics without relying on dedicated design resources.
Content Creation for Digital Media
Bloggers, journalists, and social media managers can utilize ChartFromText to enrich their online content with engaging, data-driven graphics. When writing an article about industry trends, a blogger can easily convert a few key statistics into a bar graph to break up text and illustrate a point. The high-resolution download ensures the image is web-ready, and the no-account feature streamlines the workflow for creators who need a quick, reliable tool without committing to a subscription for occasional use.
Personal Finance and Project Budget Tracking
Individuals and small team leads can apply ChartFromText to visualize personal or project-based financial data. Someone managing a household budget can input monthly expense categories and amounts to see a clear pie chart of spending distribution. Similarly, a freelancer or project manager can illustrate how a project's total budget is allocated across different workstreams like development, design, and administration. This visual breakdown makes it easier to identify areas for adjustment and communicate financial plans simply and effectively.
ScopeSnap
Freelance Development Projects
Freelancers can leverage ScopeSnap to turn initial discovery conversations into well-defined project scopes and proposals. This ensures that they start projects with a clear understanding of client expectations, reducing the chances of scope creep.
Software Agency Client Engagement
Software agencies can use ScopeSnap to enhance their client engagement processes. By converting messy notes into structured documents, agencies can present professional proposals that reflect their understanding of client needs, thus fostering trust and credibility.
Project Scope Refinement Workshops
Teams can utilize ScopeSnap during project scope refinement workshops. The tool facilitates discussions by providing a structured view of project requirements, helping teams to collaboratively address open questions and concerns before finalizing the scope.
Risk Management in Project Estimation
ScopeSnap assists in risk management by ensuring that all aspects of a project are thoroughly considered during the estimation phase. By identifying assumptions and open questions, developers can mitigate potential issues that could arise later in the project.
Overview
About ChartFromText
ChartFromText is a specialized, web-based data visualization platform engineered to transform raw, unstructured text data into professional-grade charts with unparalleled speed and simplicity. Its core functionality revolves around an intelligent text parser that interprets plain text inputs, such as "Marketing, 22000" on separate lines, and instantly converts them into visual formats including pie charts, bar graphs, and line graphs. The tool is meticulously designed for a broad spectrum of users who require immediate, hassle-free chart creation without the steep learning curve of traditional software like Excel or complex design tools. This includes students compiling data for projects, educators creating instructional materials, content creators enhancing blogs and social media, and business professionals needing quick visuals for reports and presentations.
The primary value proposition of ChartFromText is its elimination of procedural friction in data visualization. By removing the need for manual table creation, software installation, account registration, or any form of payment, it democratizes access to effective charting. Users can focus entirely on their data's narrative, pasting it directly from sources like spreadsheets, documents, or notes. The platform then handles the rendering, offering customization options for titles, colors, and label display, culminating in a downloadable, high-resolution image. In essence, ChartFromText serves as an immediate bridge between raw data and actionable insight, making complex information accessible, understandable, and presentation-ready within seconds.
About ScopeSnap
ScopeSnap is an innovative AI-driven tool designed to streamline the process of scoping custom software projects for freelance developers and software agencies. It takes the chaos of messy discovery notes and transforms them into structured project scopes, comprehensive estimates, and polished proposals that are ready to present to clients. The main value proposition of ScopeSnap lies in its ability to simplify the often tedious and error-prone task of project estimation. By leveraging artificial intelligence, it enables users to break down project ideas into clear, estimable tasks, ensuring that all requirements are captured and understood. This not only saves time but also mitigates the risks associated with vague project scopes, allowing developers to focus on delivering quality solutions instead of getting bogged down in paperwork.
Frequently Asked Questions
ChartFromText FAQ
What data format does ChartFromText accept for input?
ChartFromText is designed to accept simple, plain-text formats for effortless data entry. The most common and recommended format is to enter each data point on a new line, with the label and value separated by a comma, like this: "Label, Value". For example: "Development, 45000". The tool's intelligent parser is built to recognize this structure automatically. You can typically copy this directly from a two-column spreadsheet selection or type it manually, making the process highly flexible and user-friendly.
Is ChartFromText really free, and are there any watermarks?
Yes, ChartFromText is completely free to use with no hidden costs or subscription requirements. There are no watermarks placed on any of the charts you generate and download. All features, including full customization options and high-resolution PNG downloads, are available without any limitations. The service operates without requiring user accounts, ensuring both cost-free and privacy-respecting access to all its functionalities.
Can I create charts other than pie charts with this tool?
Absolutely. While the platform prominently features its pie and donut chart generator due to their specific use case, ChartFromText is capable of creating other fundamental chart types. This includes bar graphs, which are ideal for comparing quantities across different categories, and line graphs, which are perfect for illustrating trends over time. The same simple text-input principle applies, making it a versatile tool for various data visualization needs beyond part-to-whole analysis.
How do I download and use the chart I create?
Once you have pasted your data and customized your chart using the options for title, colors, and label display, you click the "Generate Chart" button. A preview of your chart will appear on the page. After verifying the chart meets your needs, simply click the "Download as PNG" button. This will save a high-resolution PNG image file directly to your device. You can then insert this image into presentation software like PowerPoint, word processors like Microsoft Word, website builders, or any other digital or print medium.
ScopeSnap FAQ
How does ScopeSnap ensure accuracy in project estimates?
ScopeSnap enhances accuracy by breaking down project ideas into detailed tasks and allowing users to refine estimates through a structured process. This collaborative approach ensures that all team members contribute their insights, leading to more reliable estimates.
Can I integrate ScopeSnap with other project management tools?
Yes, ScopeSnap is designed to integrate with various project management tools, allowing users to seamlessly transition from scope creation to project execution without losing valuable information.
Is ScopeSnap suitable for teams of all sizes?
Absolutely. Whether you are a solo freelancer or part of a large software agency, ScopeSnap scales to meet your needs, providing tools that enhance collaboration and efficiency regardless of team size.
What types of projects can ScopeSnap be used for?
ScopeSnap is versatile and can be used for a wide range of custom software projects, including web applications, mobile apps, and enterprise solutions. Its structured approach to project scoping makes it applicable across various domains and industries.
Alternatives
ChartFromText Alternatives
ChartFromText is a specialized productivity tool within the data visualization category. It streamlines the process of creating charts by allowing users to input plain text, which is then instantly converted into visual formats like pie, bar, and line graphs. This approach is designed for simplicity and speed, making it accessible to a broad audience. Users may seek alternatives to ChartFromText for various reasons. Common motivations include the need for more advanced chart types, deeper customization and analytical capabilities, integration with other software platforms, or different pricing models. Some users require offline functionality or enterprise-level features that a basic online tool may not provide. When evaluating an alternative, key considerations should include the range of supported chart types, the depth of customization and data manipulation tools, export quality and format options, and overall ease of use. The ideal choice balances the tool's power with the user's specific technical skill level and project requirements, ensuring it enhances rather than complicates the workflow.
ScopeSnap Alternatives
ScopeSnap is an innovative tool designed to streamline the process of project scoping and proposal creation for freelance developers and software agencies. By leveraging AI technology, ScopeSnap transforms chaotic discovery notes into well-structured project scopes, estimates, and client-ready proposals, significantly enhancing productivity in the software development space. Users often seek alternatives to ScopeSnap for a variety of reasons, including pricing considerations, specific feature requirements, or the need for compatibility with different platforms. When exploring alternatives, it is essential to consider factors such as ease of use, the ability to customize scopes and proposals, integration with existing tools, and the overall effectiveness of the solution in addressing the unique challenges of project estimation and management in software development.