StatPecker
StatPecker transforms your data into stunning visuals and AI-driven insights for easy sharing and impactful.
Visit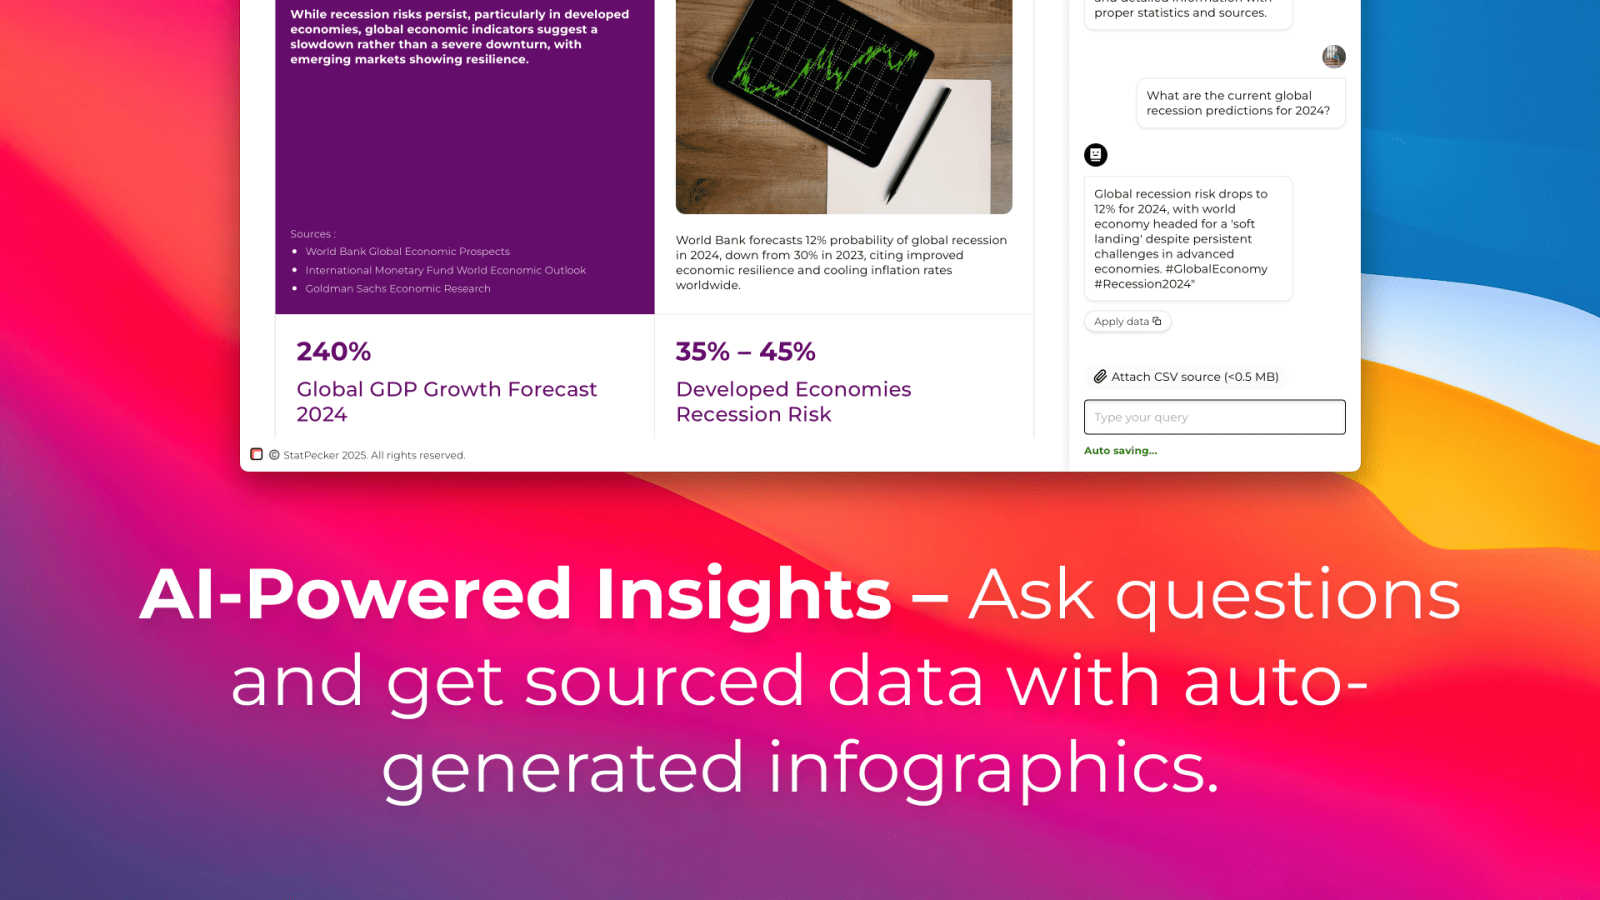
About StatPecker
StatPecker is a cutting-edge AI-powered tool that revolutionizes the way users visualize and interpret data. By transforming raw data into engaging infographics in just seconds, StatPecker caters to a diverse audience including content creators, analysts, marketers, and educators. Its main value proposition lies in simplifying the data storytelling process, allowing users to communicate complex information in a visually appealing manner. With the ability to automate visualization, StatPecker eliminates the need for manual reporting or hiring costly designers, significantly saving time and reducing operational costs. Users can effortlessly upload CSV files, interact with the AI for data queries, and generate dynamic visuals that enhance reports and presentations. This platform empowers individuals and teams to present data in an accessible and understandable format, promoting insightful data analysis and informed decision-making.
Features of StatPecker
Ask Your Query
StatPecker allows users to gain instant insights by simply asking questions related to their data. This feature eliminates the complexity often associated with traditional data analysis tools, making it accessible for users without extensive technical expertise.
Publish & Embed
With the ability to make visuals interactive, users can seamlessly integrate their infographics into blogs, articles, and websites. This feature enhances content engagement and allows for more dynamic presentations of data-driven insights.
Upload & Analyze CSVs
Users can upload CSV files of up to 50 MB and analyze them locally without the need for extensive spreadsheet manipulation. This feature ensures that data remains private while being prepared for insightful analysis.
Download & Use Anywhere
StatPecker enables users to export their created infographics as images, making them easy to use in reports, presentations, and other formats. This versatility ensures that users can share their findings across various platforms without limitations.
Use Cases of StatPecker
Content Creation
Content creators can leverage StatPecker to generate visually stunning infographics that enhance their articles and blogs. By integrating compelling visuals, they can attract more readers and effectively communicate their messages.
Data Reporting
Analysts can use StatPecker to automate the creation of reports, transforming complex datasets into clear, understandable visuals. This functionality saves time and allows for more accurate reporting, enabling teams to make informed decisions quickly.
Marketing Insights
Marketers can extract key trends and insights from their data using StatPecker, creating engaging visuals that can be shared across social media and marketing campaigns. This enhances the presentation of marketing strategies and results.
Educational Resources
Educators can utilize StatPecker to create infographics that facilitate better understanding of complex subjects for their students. By visualizing information, teachers can enhance learning experiences and improve knowledge retention.
Frequently Asked Questions
How does StatPecker ensure data privacy?
StatPecker operates with a local SQL agent, which means that all data analysis occurs on the user's device. This ensures that sensitive information remains private and secure during the analysis process.
Can I use StatPecker for free?
Yes, StatPecker offers a free tier that allows users to start creating infographics without any upfront costs. This includes access to unlimited projects, embeds, and a limited number of AI queries and CSV uploads.
What types of files can I upload to StatPecker?
Users can upload CSV files of up to 50 MB for analysis. This feature is designed to simplify data management and extraction of insights without the complexities of traditional spreadsheet software.
What support options are available for StatPecker users?
StatPecker provides users with access to a knowledge base and customer support to assist with any queries or issues they may encounter while using the platform. Users can also provide feedback for feature requests and improvements.
Explore more in this category:
Similar to StatPecker
Planning a relocation or long-term stay abroad? Compare places on sunshine, cost, tax, visa and stay duration, then ask AI about your shortlist.
Decision support framework for high consideration businesses with mix of online and offline channels, content-rich sites, and long customer journeys.
AI sales assistant providing real-time objection handling and tactical phrasing directly during live calls to boost team close rates.
AI motion graphics and map animation generator for content creators, editors, founders and marketers.
Reelry creates on-brand, faceless TikTok reels by learning your website, allowing you to post consistently without filming or editing.
EnsembleData provides real-time social media data APIs for seamless extraction of posts, profiles, comments, and analytics at scale.